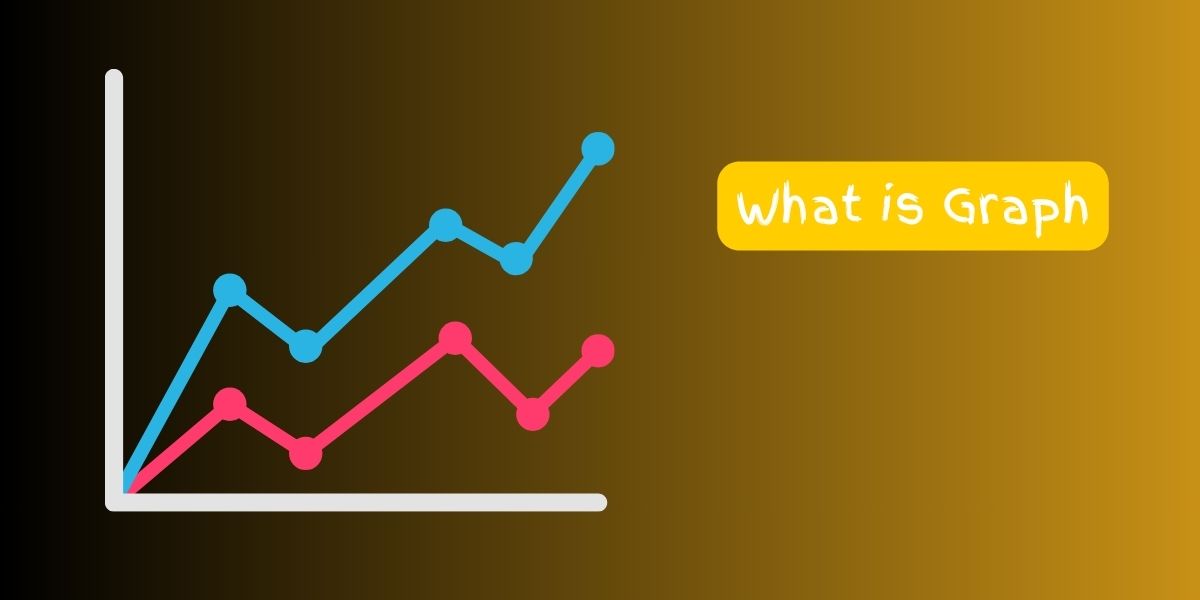
A graph is like a special picture that helps us understand numbers and information in a visual way. It’s like drawing a picture with numbers!
Here’s how it works:
- Points and Lines: A graph has two main parts: points and lines. Points are little dots, and lines connect those dots together.
- X and Y Axis: Imagine the graph is like a big piece of paper with two lines on it—one going up and down (vertical), and the other going sideways (horizontal). We call these lines the X-axis and the Y-axis.
- Plotting Points: Imagine you have some numbers that you want to show on the graph. You find where those numbers go on the X-axis and the Y-axis and put little dots there to represent them. Each dot represents a point on the graph.
- Connecting the Dots: Once you have all your dots on the graph, you can connect them with lines. This helps us see how the numbers change or relate to each other.
Here’s an example:
Let’s say you have a graph with the X-axis representing time (in days) and the Y-axis representing temperature (in degrees Celsius). You might plot points for each day’s temperature, like this:
- Day 1: 20°C
- Day 2: 22°C
- Day 3: 25°C
- Day 4: 23°C
You would find where each temperature goes on the graph and put a dot there. Then you’d connect the dots to see how the temperature changes over time.
Applications of Graphs:
- Mathematics: Graphs are widely used in mathematics to represent functions, equations, and geometric shapes.
- Science: Scientists use graphs to visualize data from experiments, such as temperature changes, growth rates, or chemical reactions.
- Economics: Graphs are used in economics to illustrate trends in markets, consumer behavior, and economic indicators.
- Engineering: Engineers use graphs to analyze structural designs, electrical circuits, and performance metrics.
- Computer Science: Graphs are used in computer science to model networks, algorithms, and relationships between data points.
Graphs help us understand complex information more easily and make connections between different pieces of data. So, the next time you see a graph, remember that it’s like a special picture that tells us a story with numbers!


No responses yet